One Project To Learn Time Series Forecasting
Apr 28, 2024
Let’s predict taxi demand in NYC
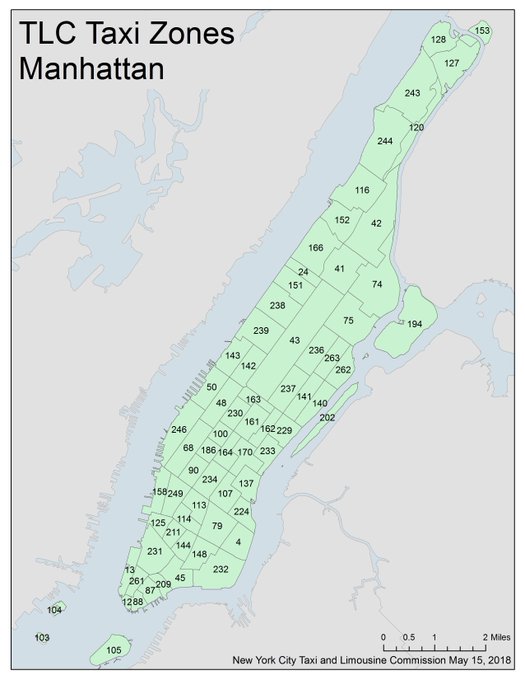
Let’s create a predictive model to forecast the number of taxi rides that will happen in Manhattan (New York City)
- per hour (e.g. tomorrow between 5 PM and 6 PM), and
- per zone (e.g. Zone 113 “Lower Manhattan)
in the following 3 days.

This model can help the operations team of the NYC taxi Commission optimize the distribution of the taxi fleet, in real-time, and maximize revenue.
Here are the steps to build this project.
Step 1. Fetch historical data on taxi rides 🚕
You can get this data from the NYC Taxi & Limousine Commission website.
There you will find month-by-month raw data on historical taxi rides, in Parquet format → Link to the data
Step 2. Pre-process the data into a time series format 📈
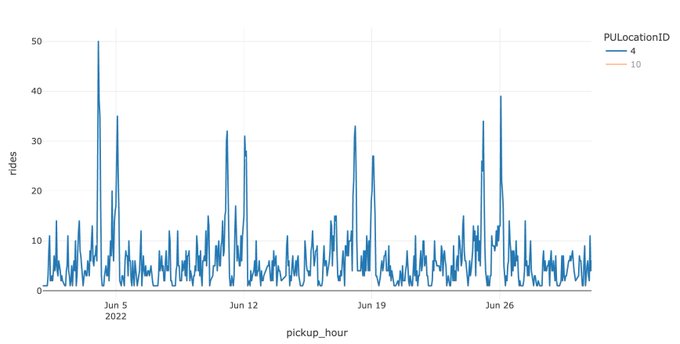
Aggregate the number of rides based on the hour and location of the pickup.
The resulting dataset has 3 columns:
1 → Pick up timestamp, rounded to the closest hour 🕐
2 → Pick up location 📍
3 → Number of rides 🚕

Step 3. Train a predictive model 🏋️
Prophet is an open-source library by Facebook for time-series prediction. And it works like a charm for time series with strong patterns, like taxi demand.
→ This tutorial will get you up and running real quick.
Step 4. Push the code to GitHub 👩💻👨🏾💻
Make your work public, to increase its visibility and help you land (an even better) job.
Don’t forget to add a beautiful README file to the repo, where you explain
→ WHAT the business problem is, and
→ HOW you solved it

